Running a restaurant without tracking your numbers is like driving blindfolded. You might feel like you’re headed in the right direction, but you’ll hit the wall sooner or later. Many owners pour their hearts into the kitchen and service, but overlook the key ingredient to growth: understanding the numbers. That’s where restaurant revenue statistics come into play.
They’re not just a nice-to-know — they’re a must-know.
By monitoring your restaurant data, you’ll spot what’s working, what’s leaking profits, and where you can level up; it could be your menu or improving operations using restaurant order management systems.
The solution? Get a grip on your numbers, and let them guide smarter, faster, more profitable decisions.
Table of Contents
ToggleWhy restaurant revenue stats matter
The numbers do not lie in business.
Restaurant revenue statistics tell you if your efforts are paying off or not. They also help you see if you’re making enough money to cover your restaurant costs and expenses, pay your team, and still turn a profit.
Tracking revenue also means knowing what’s working, which menu items or promotions bring in the most cash, and where you might need to make changes.
It’s necessary for planning ahead, managing day-to-day operations, and showing potential restaurant investors or lenders that your business is worth betting on.
The bottom line here: if you’re not watching your revenue data, you’re flying blind.
Looking at the big picture: What the restaurant industry’s revenue is telling you
The food service industry is one of the most heavily concentrated areas in business. In 2023, it had a market value of approximately $3.1 trillion and was projected to reach a CAGR of 3.0% in 2030.
In addition, according to Precedence Research, restaurants alone (as part of the food service) have a market size that accounted for $14.75 billion in 2024 and is expected to reach $15.38 billion in 2025.
The numbers speak for their growth; they expect to generate larger revenue for the forecasted years.
To give you an idea of the global bottom lines, let’s break down the restaurant industry into its various sectors:
Full-service restaurants
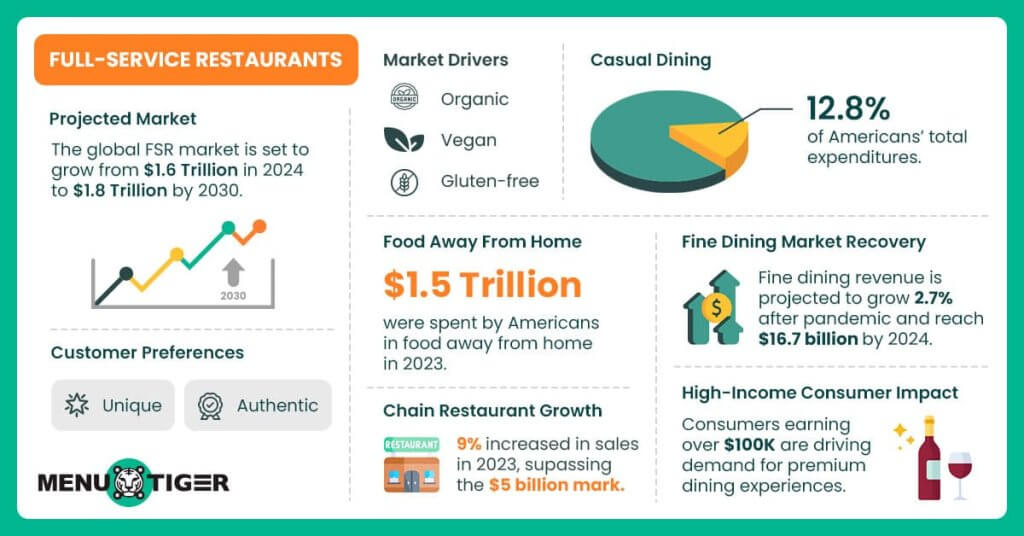
Full-service restaurants (FSRs) offer customers a comprehensive dining experience, including table service, various food and beverage options, and better customer service.
Research and Markets’ 2024 industry report showed a staggering $1.6 trillion global market value and a projection of $1.8 trillion in 2030.
This significant growth is greatly influenced by the industry’s continued response to evolving customer preferences, who seek unique and authentic dining experiences that offer more than just food.
A growing trend towards health-conscious dining options, with a noteworthy demand for restaurants offering organic, vegan, and gluten-free menus.
Moreover, this breakthrough brought an increase in revenue for its two main segments (essentially in the United States):
- Casual dining
According to the US Bureau of Labor Statistics, this segment accounts for 12.8% of Americans’ total expenditures.
A review of the US Department of Agriculture’s Economic Research Service found that in 2023, Americans spent around $1.5 trillion on food away from home (FAFH).
This explains that casual-dining restaurant chains continued flourishing despite experiencing unsteady numbers due to inflation-fatigue.
Olive Garden, a 42-year-old Italian chain, is a testament to that. Restaurant Business site revealed that with its 908 US locations, the systemwide operations saw an increase in sales by nearly 9% in 2023 and surpassed the $5 billion mark.
- Fine dining
The global pandemic undoubtedly damaged the industry, yet fine-dining restaurants are set to return to strong growth.
IBISWorld reported that the revenue of the restaurant industry will increase by 2.7% to $16.7 billion by 2024.
The growth in the per capita disposable income of consumers earning more than $100,000 annually has benefited the industry, enabling consumers to opt for premium dining.
Quick-service restaurants
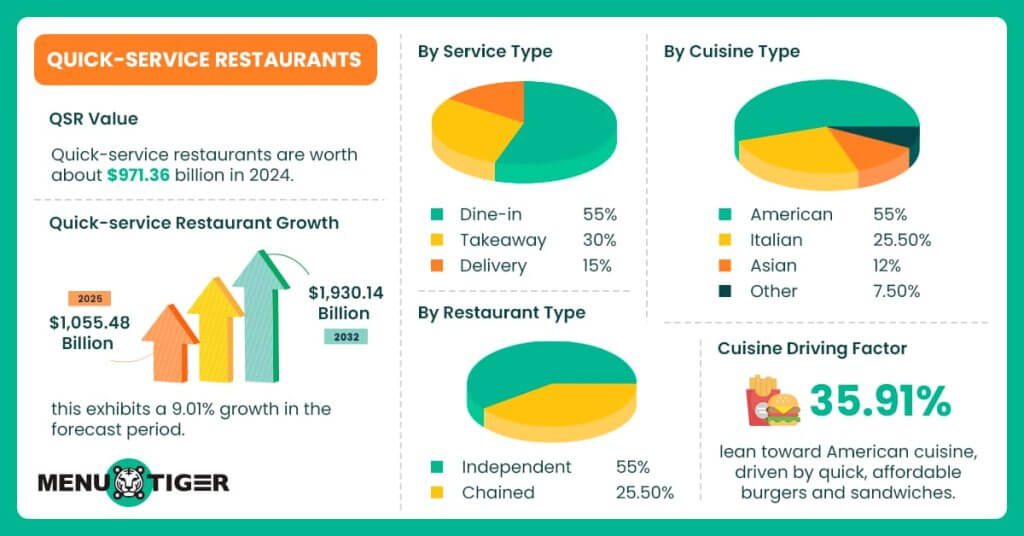
According to Fortune Business Insight, the quick service restaurant industry is worth about $971.36 billion in 2024. They are projected to grow from $1,055.48 billion in 2025 to $1,930.14 billion by 2032, exhibiting a 9.01% growth in the forecast period.
Let’s take a look at the sales and revenue indicators:
- By service type (Dine-in, takeaway, and delivery)
The industry report indicated that the dine-in segment is expected to lead the market growth in the coming years.
Its 55% market share supports the progressive revenue a restaurant generates through orders placed on the site. Many consumers prefer to go out regularly for a whole dining experience, which results in increased footfall in restaurants.
On the other hand, takeaway claimed around 30% of the market share, as this type of service was popular before the online food delivery concept became popular.
However, the growth of online good delivery platforms has been seen in the last decade alongside the rising penetration of advanced technology, a changed consumer lifestyle, and the ease of ordering food.
This led to a 15% market share in the 2024 data and is expected to record a high CAGR during the forecast period.
- By cuisine type (American, Italian, Asian, others)
Approximately 55% of the market share of American cuisine is due to the dominance of various burger chains, including McDonald’s and Burger King, in almost all major markets like the U.S., Europe, China, Japan, India, and Australia.
The driving factor for this number is the popularity of burgers and sandwiches, the most consumed fast food items, with 35.91% in the 2020 report, mainly because they are served quickly and are available at an affordable price range.
This is followed by Italian cuisine with approximately 25.50%, Asian cuisine with 12%, and another cuisine with 7.5%.
- Restaurant type (Independent, chained)
The independent restaurant segment currently dominates the market with 60% of market share, owing to the ease of setting up a single store with lower restaurant cost and expenses.
Developing economies like ASEAN countries, Mexico, Brazil, and India have established several independent QSR outlets, surpassing the number of chained stores.
But because they’re independent, their revenue is minimal.
That’s why the chained store share, though 40% globally, is still high in these countries. Due to the expansion plans by franchise restaurants like Domino’s, McDonald’s, and Starbucks, it is expected to have the highest growth rate over the forecast period.
Food trucks and mobile kitchens
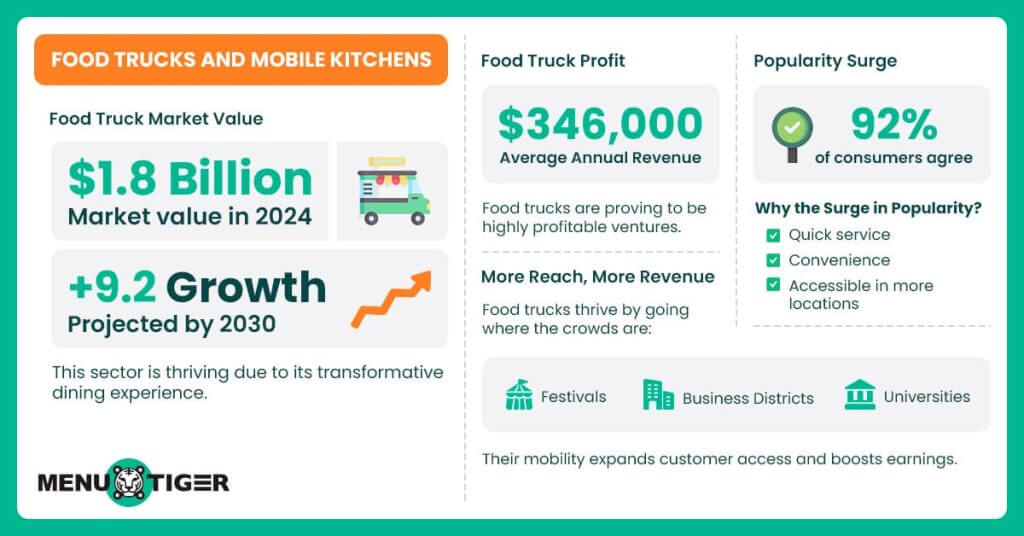
Representing a staggering $1.8 billion market in the U.S. in 2024 and expected to grow by 9.2% in 2030, this sector is thriving due to its transformative dining experience.
In a recent report, Food Truck Profit found that in 2025, the average revenue in the U.S. will be around $346,000.
This is because of its convenience and quick service, which 92% of consumers strongly agreed with.
Moreover, its mobile nature allows food truck operators to widen their reach, such as in festivals, business districts, and college campuses, further adding to their revenue streams.
Catering services
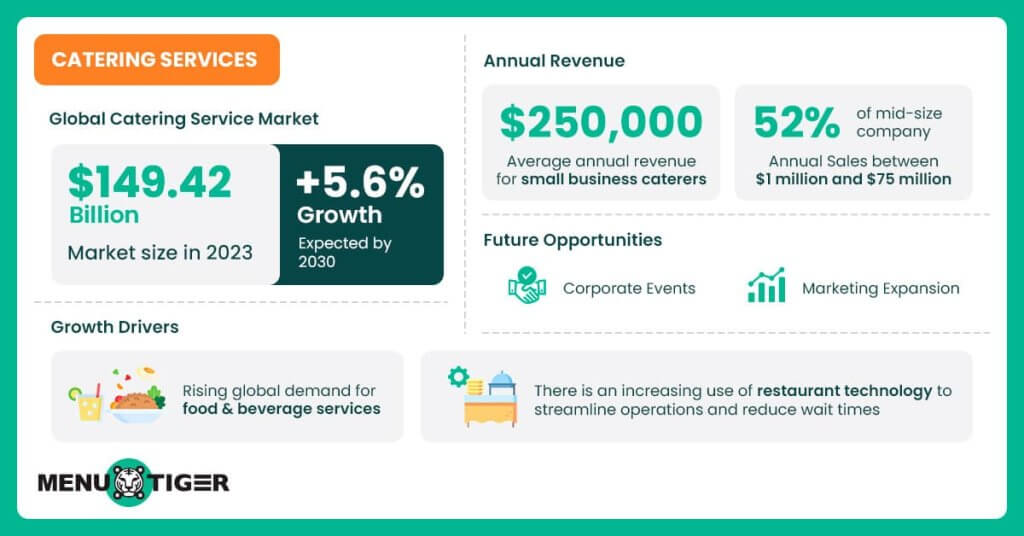
Maximize Market Research (MMR) reported that the global catering service market size will be $149.42 billion in 2023, and total revenue is expected to grow by 5.6% by 2030, reaching $218.81 billion.
The increasing demand for food and beverages opened opportunities for catering services, which have been one of the driving forces behind their growth.
Its use of restaurant technology to improve operations and reduce wait times brought a considerable advantage for business owners.
Nuphoriq, an International Catering Association (ICA) partner, specified that small business caterers generate a $250,000 annual revenue.
52% of mid-size catering companies have annual sales between $1 million and $7.5 million.
With this constant growth, catering services are poised for a larger market share with the resurgence of corporate events and the expansion of marketing strategies, reaching more potential clients.
Ghost kitchens and virtual restaurants
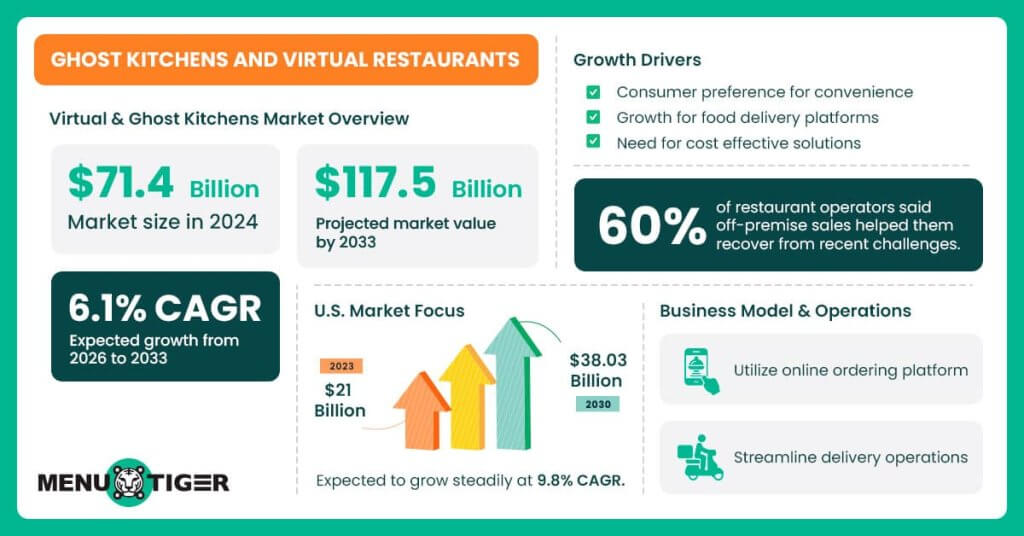
Verified Market Reports emphasized that the delivery-only dining concept has brought virtual and ghost kitchens to the forefront, with a market size estimated to be $ 71.4 billion in 2024.
With its growing popularity, the market is expected to reach $117.5 billion by 2033 and grow at a CAGR of 6.1% from 2026 to 2033.
In the U.S., the ghost kitchen market was valued at $21 billion in 2023 and will grow 9.8%, reaching $38.03 billion by 2030.
These establishments operate with the traditional brick-and-mortar model and leverage online ordering platforms to streamline their operations and optimize the delivery process.
The demand is driven by several factors, including changing consumer preferences for convenience, the rise of food delivery platforms, and the increasing need for cost-effective operational solutions.
The National Restaurant Association supported the success of off-premises sales, saying 60% of restaurant operators vouched for its effectiveness in helping them recover from recent years’ pitfalls.

How to calculate your revenue
Here’s how you simply do it:
| Revenue = Price x Quantity Sold |
In the context of a restaurant, this means:
- Price = the amount you charge per item
- Quantity Sold = the number of items sold in a given period (e.g., daily, weekly, or monthly)
For example;
If you sell 100 cocktails at $12 each and 50 appetizers at $8 each, the total revenue is:
| Revenue = (100 x 12) + (50+ 8) = $1,200 + $40 = $1,600 |
Looking at the lens: 5 revenue metrics and indicators that you may miss out on

This list explains revenue metrics and indicators to give you an overview of their broader aspects and help you better understand growth and management.
- Sales per square foot
Sales per square foot are a critical performance metric that helps you measure how efficiently your business generates revenue relative to its physical space.
In simple terms, it connects the size of your space to how much money you’re making, helping you determine whether every square foot is being used most profitably.
Here’s how to calculate:
| Sales per square foot (SPSF) = Total Net Sales ÷ Total Square Feet of Selling Space |
Note: Total Net Sales are the revenue generated from sales, excluding taxes and returns. Selling Space only accounts for the area used to display and sell products or serve customers (not storage, restrooms, offices, etc.).
For example;
| SPSF = Total Net Sales ÷ Total Square Feet of Selling Space = $800,00 ÷ 1,000 sq ft SPSF = $ 800 per sq ft |
Given that you achieve the same result as the example and generate the same revenue as someone using 500 square feet, your costs are relatively higher, and your profits are lower.
Meanwhile, a higher sales per square foot means you’re maximizing revenue from every inch you’re paying for.
If you find your numbers in this situation, you should reorganize your layout. Similarly, if your restaurant’s specific section or service area brings more revenue per square foot, you can shift resources and attention to grow that part.
- Revenue Per Available Seat Hour (RevPASH)
Another performance metric to consider is sales per seat per hour (RevPASH), which helps measure a space’s efficiency in generating revenue from each seat over time.
It answers this simple yet essential question: How much money are you making from each seat, each hour your business is open?
Here’s how it’s done:
| RevPASH = Total Revenue ÷ (Number of Seats x Number of Operating Hours) |
Suppose;
| RevPASH = $4,000 ÷ (40 seats x 10 hours) = $4,000 ÷ 400 seat-hour RevPASH = $10 per seat per hour |
This means you’re earning $10 for every seat, every hour your restaurant is open.
If you know that during lunch, your average would come up with $15/seat/hour, and then in the afternoon, it drops to $4/seat/hour, you’ve now identified a slow time.
This is an opportunity for you to introduce happy hour deals, offer limited-time offers, or speed up services using a restaurant order management system to turn tables faster.
Let’s say you want to raise your RevPASH to $12 per/hour. That would mean you need:
| Total Daily Revenue = 40 seats x 10 hours x $12 = $4,800 = $4,800 – $4,000 (The total revenue) = $800 |
This means you need to increase restaurant sales by $800 daily and build strategies around that.
- Average order size
The average order size (AOS) is a metric that measures the average amount spent per customer during a transaction, whether per visit, meal, or purchase.
This is essential to gauge how much revenue you’re making per order and can highlight growth opportunities, especially if your goal is to increase revenue without necessarily increasing traffic.
Follow this formula to calculate AOS:
| Average Order Size = Total Revenue ÷ Number of Orders |
Let’s say;
| AOS = $5,000 ÷ 200 = $25 per order |
This means on average, each customer spent $25 during their visit.
Knowing this assists you in tracking whether your pricing, menu, and service model are generating the revenue you expect.
For instance, you aim for $30 per customer, but your average is $20. That indicates there’s room to increase spending per visit.
That’s when upselling comes in. You can offer add-ons like appetizers and drink pairings to significantly increase the average order size.
- Profit margins
To indicate your business’s profitability, understanding profit margins is critical to show how much profit is retained from its total revenue after covering all expenses.
Here are the types of profit margins you need to know:
- Gross profit margin
This margin helps measure the core operations’ profitability, excluding indirect costs like rent, utilities, and salaries. It’s calculated as;
| Gross Profit Margin = (Revenue – Cost of Goods Sold) ÷ Revenue |
For example, if your restaurant generates around $100,000 in revenue and your food cost (COGS) is $35,000, then the gross profit would be;
| Gross Profit Margin = ($100,000 – $35, 000) ÷ $100, 000 = $65, 000 ÷ $100, 000 = 0.65 x 100% = 65% |
This means that 65% of your revenue is retained after covering the direct costs of food and ingredients.
- Operating profit margin
This accounts for your operating expenses like labor, rent, utilities, and other overhead costs.
| Operating Profit Margin = Operating Income ÷ Revenue |
Your operating income is your gross profit minus your operating expenses. Let’s say you’re operating income is $15,000 on $100,000 revenue, your operating profit margin would be:
| Operating Profit Margin = $15,000 ÷ $100,000 = 0.15 x 100% = 15% |
- Net profit margin
The net profit margin is the most comprehensive profit indicator, as it includes all expenses—food, labor, overhead, taxes, interest, and more.
| Net Profit Margin = (Net Income) ÷ Revenue |
For example, the revenue is $100,000, and you had a $5,000 net income after all the expenses, your net profit margin would be:
| Net Profit Margin = $5,000 ÷ $100,000 = 0.05 x 100% = 5% |
Understanding your profit margin lets you know how well you manage costs relative to your revenue.
A higher margin typically means you’re operating efficiently, keeping costs under control, and maintaining a sustainable level of profitability.
5. Customer Acquisition Cost (CAC)
This is a critical metric to help you understand how much it costs to acquire a new customer.
It’s directly tied to the effectiveness of marketing, sales, and promotional efforts. Here’s how to calculate it and how it relates to revenue:
| CAC = Total Marketing and Sales Costs ÷ Number of New Customers Acquired |
The total marketing and sales costs include all costs associated with acquiring customers, including advertising, marketing campaigns, sales team expenses, promotional materials, and technology tools used for marketing and sales.
The number of new customers acquired is simply the number of new customers you’ve gained during a specific period.
For example, if you spent $10,000 on marketing and sales and acquired 500 new customers, the CAC would be;
| CAC = $10,000 ÷ 500 = $20 |
So, it costs $20 to acquire each new customer.
This is then linked to your revenue as it helps you to determine how much you need to make back from each customer to cover the cost of acquiring them.
So, if your CAC is high compared to the revenue you earn from a customer, you’re spending more on acquiring customers than you’re making from them.
Why online and delivery sales can effectively increase revenue for restaurants

It’s no surprise that delivery services and online ordering platforms for restaurants have been a great help to restaurants because of their proven efficiency in bringing in sales.
Globally, it had a market value of $232 billion in 2023 and is projected to surpass $637.36 billion by 2024.
This alone is sufficient to claim that it greatly drives increased restaurant revenue, but let’s assess why it is so.
- Wide customer reach
Online and delivery platforms are one of the restaurant industry trends that break physical barriers, allowing restaurants to serve and reach customer outside their immediate location.
Apps or even digital QR code menus effectively introduce your business beyond your area, encouraging a more diverse customer base.
- High Average Order Value
Digital menus and upsell prompts encourage larger orders. Customers often buy more than they would in person without time pressure or social constraints.
- Increased order frequency
Convenient reordering, loyalty rewards, and push notifications prompt more frequent purchases. Many restaurants see 20% to 30% more orders per customer through digital channels.
- Operational efficiency and data insights
Online menu ordering systems like MENU TIGER can provide real-time sales data, helping you forecast demand, and schedule staff more effectively
This is essential to boost profit margins as you can do more in just one system alone in a cheaper option than having it done individually.
- Scalable revenue without physical expansion
If you still have the financial capacity to open another location, an online restaurant allows you to grow without breaking your pocket.
Just like having a restaurant order system like MENU TIGER, you can maximize your store through a QR menu app that serves as your secondary restaurant, adding a revenue stream.

Know your numbers and maximize them with digital menu ordering solutions
Whether you’re already a pro or just planting your first roots in the industry, understanding restaurant revenue statistics is non-negotiable. It’s how you measure success, make informed decisions, and determine if the opportunity you’re chasing is worth the grind.
But it might be time to pivot if your bottom line is slipping — or simply not growing fast enough.
Enter digital menu ordering systems like MENU TIGER. These platforms go beyond just sleek interfaces; they give you real-time insights, streamline operations, reduce labor costs, and boost average order size through smart upselling and intuitive design.
This isn’t just about reading charts — this is about rewriting them.
With the right digital tools, you’re tracking your numbers and transforming them. MENU TIGER gives you the power to uncover new revenue streams, improve customer experience, and scale smarter, not harder.
Don’t just run the numbers. Run them up.
Ready to triple what you thought was possible? Your future profit starts with a smarter digital menu.
FAQs
The average annual revenue for a restaurant in the U.S. varies widely based on type, size, and location.
Small independent companies earn between $250,000 and $1 million annually. This can often bring in $1 million to $2 million for fast food and casual dining spots.
You can estimate your revenue using this formula:
Revenue = Average Check Size × Number of Customers × Number of Operating Days
Here’s how each part breaks down:
1. Average Check Size: Total sales divided by the number of customers.
2. Number of Customers: You can count this directly or estimate based on daily seating capacity and table turns.
3. Operating Days: The number of days the restaurant is open in the period you’re measuring (monthly, quarterly, annually, etc.).
For example;
If a restaurant has an average check of $25, serves 100 customers a day, and operates 360 days a year, it will have:
Revenue = $25 × 100 × 360 = $900,000 annually
You can refine this by estimating revenue by meal period (breakfast, lunch, dinner) or including delivery and catering sales.
The revenue model of a restaurant outlines how it earns money through various streams and pricing strategies. At its core, it includes:
1. Primary Revenue Stream:
–Food and Beverage Sales: This is the primary source—dine-in, takeout, delivery, and catering.
2. Secondary Revenue Streams (if applicable):
–Alcohol Sales: Often with higher profit margins than food.
–Merchandise: Branded items like sauces, shirts, or packaged goods.
–Events/Private Rentals: Income from hosting parties, tastings, or corporate events.
–Subscriptions or Meal Plans: Prepaid or membership-based models.
Third-Party Partnerships: Delivery apps, cross-promotions, or hosting pop-ups.
3. Pricing Strategy:
-Menu pricing is usually designed with target food cost percentages (e.g., aiming for 30–35%) to maintain profitability.
4. Capacity and Turnover:
-Revenue is also driven by the number of guests a restaurant can serve per hour or day (RevPASH) and sales per square foot.
Profitability depends heavily on location, cost control, pricing strategy, and operational efficiency.
Despite high revenue potential, many restaurants struggle with rising costs and tight margins, making strong financial management essential.
But most restaurants operate on slim profit margins, typically between 3% and 10% of total revenue.
Quick-service and fast-casual restaurants tend to have higher margins (closer to 6–10%) due to lower labor and food costs, while full-service or fine dining establishments may only see 3–5% after expenses.

