Knowing the ever-changing numbers of restaurant industry statistics is crucial to keep up with the newest trends and stay one step ahead of your competitors.
Such changes are fueled by evolving consumer needs and preferences, economic challenges, and new technological trends like the QR code menu, which businesses must adapt to and embrace.
To kick-start this year, we have gathered relevant restaurant data, figures, and restaurant trends that you should know as you take your next business step.
Table of Contents
ToggleUS Restaurant industry statistics

1. There are over 1 million restaurants in the US. (National Restaurant Association)
2. The number of restaurant locations in the United States increased by 2% from 2019 to 2020. (Finances Online)
3. The F&B industry makes up the largest segment of the restaurant industry. It is estimated that the F &B industry currently provides 50% of all meals consumed in the United States. (Hospitalitynet)
4. Restaurants make up 4% of the GDP in the United States. (Zippia)
5. The restaurant industry is the second-largest private-sector employer in the US, with over 15 million employees. (Restaurant News)
6. Italian food is hailed as the most popular ethnic cuisine in the United States. (National Restaurant Association)
7. As of 2023, there are 137, 513 chain restaurants in the United States, a 2.1% increase in 2022. (IBISWorld)
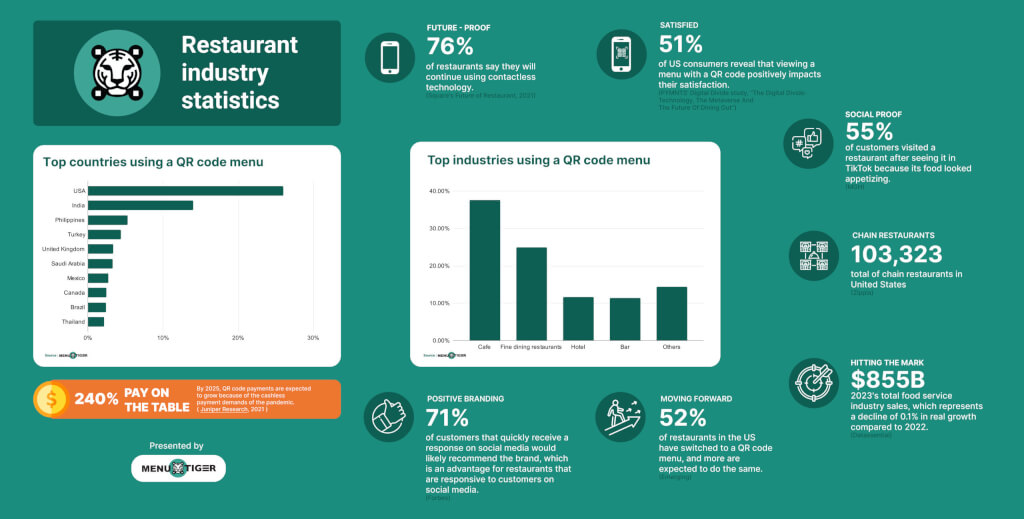
8. Total food service industry sales will hit $855 billion in 2023, which represents a decline of 0.1% in real growth compared to 2022. (Datassential)
9. There are 201,865 quick-service restaurant businesses in the US as of 2023. (IBISworld)
10. New York has the highest number of bars and nightclubs (6,519), followed by Illinois (5,275) in the US. (IBISworld)
11. As of 2022, there were about 65,410 coffee shops in the US. (National Coffee Data)
How was the restaurant industry growth affected by the pandemic?
Many food establishments succumbed to the unforeseen pandemic; some had to close temporarily, while others for good.
Restaurants had to lay off employees, which led to a labor shortage. Another challenge restaurant operators need to combat is supply delays and shortages, which leave them no choice but to reduce menu offerings.
And it doesn’t end there; some restaurants struggle to cover their looming debts, leading them to make the hard decision—business closure.
To understand the devastating effect of this health crisis, take a look at the restaurant industry data and figures below:
1. 8 million people were furloughed or laid off as restaurants had to close or be restricted. (National Restaurant Association, 2020)
2. Permanent closures have reached 97,966, representing 60% of closed businesses that won’t reopen. (Yelp)
3. 90,000 restaurant locations temporarily closed during the pandemic. (National Restaurant Association, 2021)
4. Out of the 26,000 restaurants listed on Yelp’s website, about 16,000 would not be reopening. (Yelp, 2020)
5. Six out of ten full-service restaurants reported fewer menu offerings before the pandemic. (National Restaurant Association)
6. In 2022, restaurants reduced their weekly operating hours by an average of 6.4% compared to pre-pandemic. Meanwhile, independent operators had to cut off 7.5 weekly hours. (Datassential)
7. 85% of restaurant operators reported smaller margins than before the pandemic. (September field survey, National Restaurant Association)
QR code menu
To adapt to the demands of the circumstances, a massive spike in technology and automation—like the QR code-based restaurant menu system—became evident.
These have become very helpful to restaurants since they facilitate restaurant contactless ordering and payment systems, alleviating the issue of staffing. It’s no doubt that contactless technologies have sustained the restaurant industry throughout the past years.
Here is what restaurants and customers say about contactless menus:
1. 52% of restaurants in the US have switched to a QR code menu and more are expected to do the same. (Emerging)
2. 76% of restaurant data say they will continue using contactless technology. (Square’s Future of Restaurant, 2021)
3. Of 2,500 US consumers surveyed, 51% reveal that viewing a menu with a QR code positively impacts their satisfaction. (PYMNTS’ Digital Divide study, “The Digital Divide: Technology, The Metaverse And The Future Of Dining Out”)
4. 79% of restaurant customers prefer online ordering and kiosks, while 78% enjoy QR code menu ordering. (Eater)
Restaurant industry trends: contactless payments data
The pandemic spurred interest in contactless payment through mobile wallets, cards, and QR codes. In particular, restaurant contactless ordering and tableside payment became necessary to deliver safe services.
But how exactly do contactless payments impact businesses and people? Take a look at the following contactless payment statistics to better understand them and know how to incorporate them effectively.
1. Twenty-five percent of customers prefer a digital or contactless payment method to a physical one. (Deloitte Restaurant of the Future Survey)
2. By 2025, QR code payments are expected to grow by 240% because of the cashless payment demands of the pandemic. (Juniper Research, 2021)
3. 51% of Americans use contactless payments such as credit cards and mobile wallets like Apple Pay. (Mastercard Consumer Polling)
4. 58% of consumers prefer using a QR code to pay at a restaurant, and 70% said they had a positive experience. (Datassential)
5. 43% of Millennials and Gen Z customers opt for contactless payment when dining out. (Future Restaurant Trend Report, 2022)
6. PayPal is the most used online payment service in the United States. (Statista)
7. 92.3m is the number of proximity mobile payment users in the United States. (Statista)
8. There was a 150% rise in contactless payment transactions in the United States. (Visa)
9. Most respondents (8 out of 10) from various countries worldwide revealed they had used QR codes for payments for the first time in early 2021. (Statista)
10. 58% of consumers like to have the QR code payment option when dining out and grocery shopping. (HubSpot)

Restaurant social media marketing statistics
It’s essential to keep your finger on the pulse of restaurant marketing statistics and trends. Let’s know how social media marketing can increase brand awareness.
1. 38% of Tiktok users in the US have visited or ordered food from a restaurant after seeing the food establishment on the app. (Cision)
2. 55% visited a restaurant after seeing it in TikTok because its food looked appetizing, while 51% visited because of the unique items it offers. (MGH)
3. 39% of US diners follow restaurants on social media to help them decide whether they would dine in or order food from the restaurant. (QSR)
4. 71% of customers who quickly receive a response on social media would likely recommend the brand, which is an advantage for restaurants that are responsive to customers on social media. (Forbes)
5. Most Instagram users are under 25, making it an ideal platform if your target market is Millennials. (Keap)
6. In 2021, 67% of restaurants had spent money on at least one social media advertisement or campaign. (Sprout Social)
7. Facebook is where restaurant patrons are most likely to leave positive reviews. (ReviewTrackers)
8. Videos posted on social media for restaurant promotions saw a 33% increase in overall engagements. (Gitnux Marketdata Report, 2024)
9. Positive reviews are flooding Twitter, with more than 50% of users sharing their happy experiences at a specific restaurant. (Gitnux)
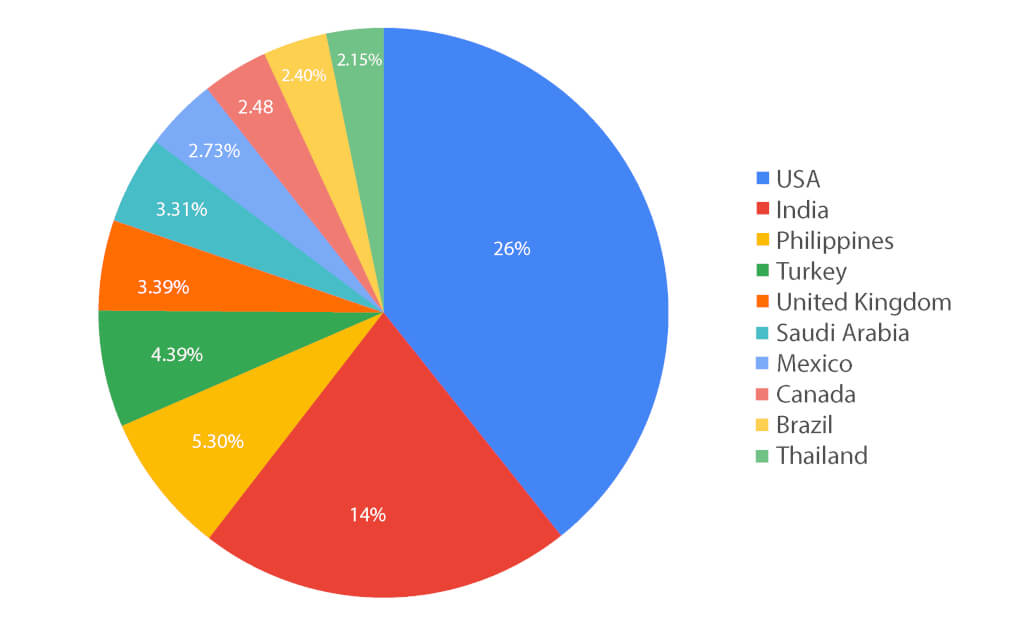
Top countries using a QR code menu
Based on MENU TIGER’s database, here are the top countries using the interactive digital menu QR code:

- USA—26%
- India—14%
- Philippines—5.30%
- Turkey—4.39%
- United Kingdom—3.39%
- Saudi Arabia—3.31%
- Mexico—2.73%
- Canada—2.48%
- Brazil—2.40%
- Thailand—2.15%
According to a Statista 2024 report, there are approximately 310 million smartphone users in the USA alone. This explains why the United States has become the leading user of QR code menus.
On the other hand, five Asian countries reached the top 10, indicating how widely QR code menus are used around the globe.
Types of industries using a QR code menu
QR codes have skyrocketed over the years, and many in the restaurant industry believe digital menus will be permanent.

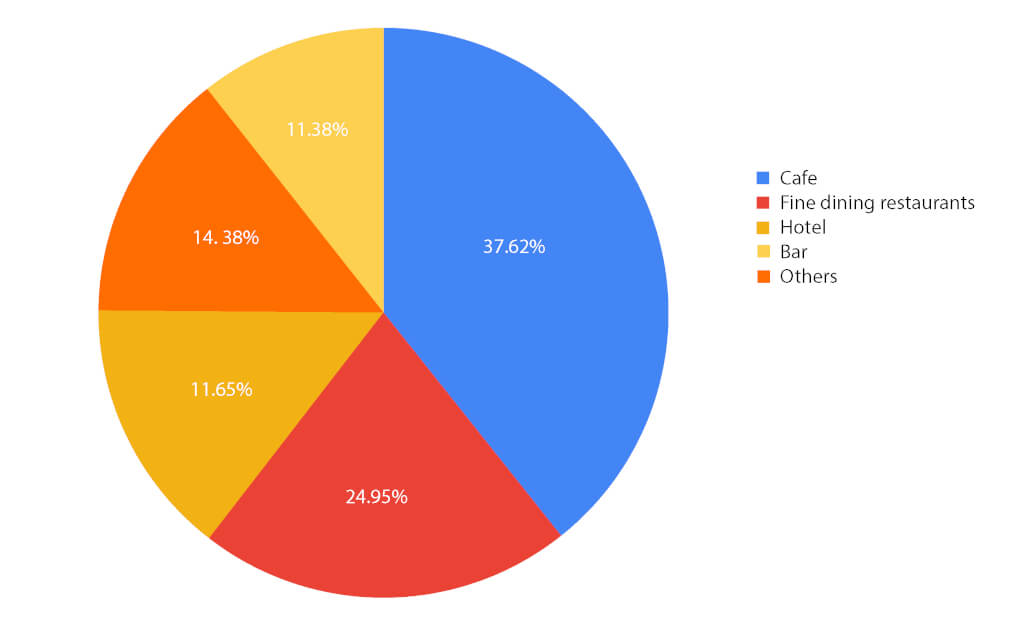
Based on MENU TIGER’s restaurant industry trends as of this month, the top industries using QR code menus are:
- Cafe—37.62%
- Fine dining restaurants—24.95%
- Hotel—11.65%
- Bar—11.38%
- Others—14. 38%
QR codes in the food and beverage industries have streamlined operations and greatly aided restaurants in providing the best customer experience possible.
QRTIGER founder and CEO Benjamin Claeys says. “We are also trying to focus on the most advanced technology but also the most affordable price. And I think that makes MENU TIGER today a strong product on the market.”
This helps restaurant operators deliver better services with the software’s helpful features, such as QR code ordering without payment—crucial for customers’ convenience.

Stay updated with the changes in the restaurant industry
Knowledge about changes and trends in the restaurant industry will significantly help you make wise and informed decision.
Stay up-to-date with the latest data on restaurant industry statistics by attending industry conferences, following industry experts online, talking with other marketers, and reading about industry publications and blogs.
You will be able to make the necessary adjustments and adapt to the current trends, like the QR code menu, which will determine your visibility in the market.


